Posted on January 4, 2013
About one year ago, for the first time in recent memory, I went on a run. I now have a lot of data running data! I also almost always run with a heartrate monitor.
The graph below represents my progress. Each point is a single run that was between 3 and 8 miles without signficant elevation gain and with a reasonably low standard deviation in pace. For each run, I calculate my mean pace over all 1 mile continuous subsections of the run where my heart rate was within the range [165, 180] (typical moderate-hard effort for me). This gives a crude measurement of the pace that I’m able to sustain at a given heart rate.
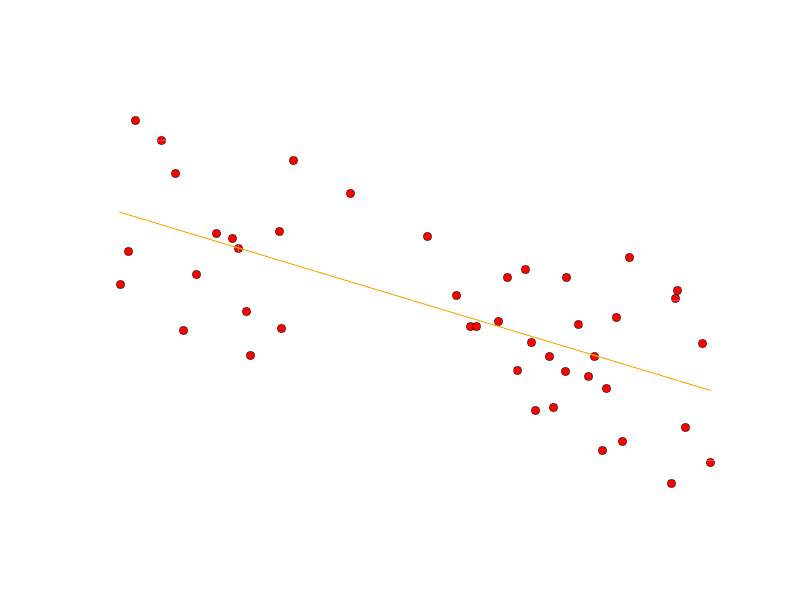
There are only about 40 runs shown, because I don’t always have a heart rate monitor, and I’ve filtered many of the runs. A simple linear fit of the data gives a slope of ~1.68 seconds/(week * mile). I’m getting faster by almost two seconds a mile every week.